Contents
% Script to display the different superSegger methods
Get tryMe-file's location
FulllocationOfFile = mfilename('fullpath');
fileSepPosition = find(FulllocationOfFile==filesep,1,'last');
filepath = FulllocationOfFile ( 1 :fileSepPosition);

dirname = [filepath,'60mrnaCropped'];
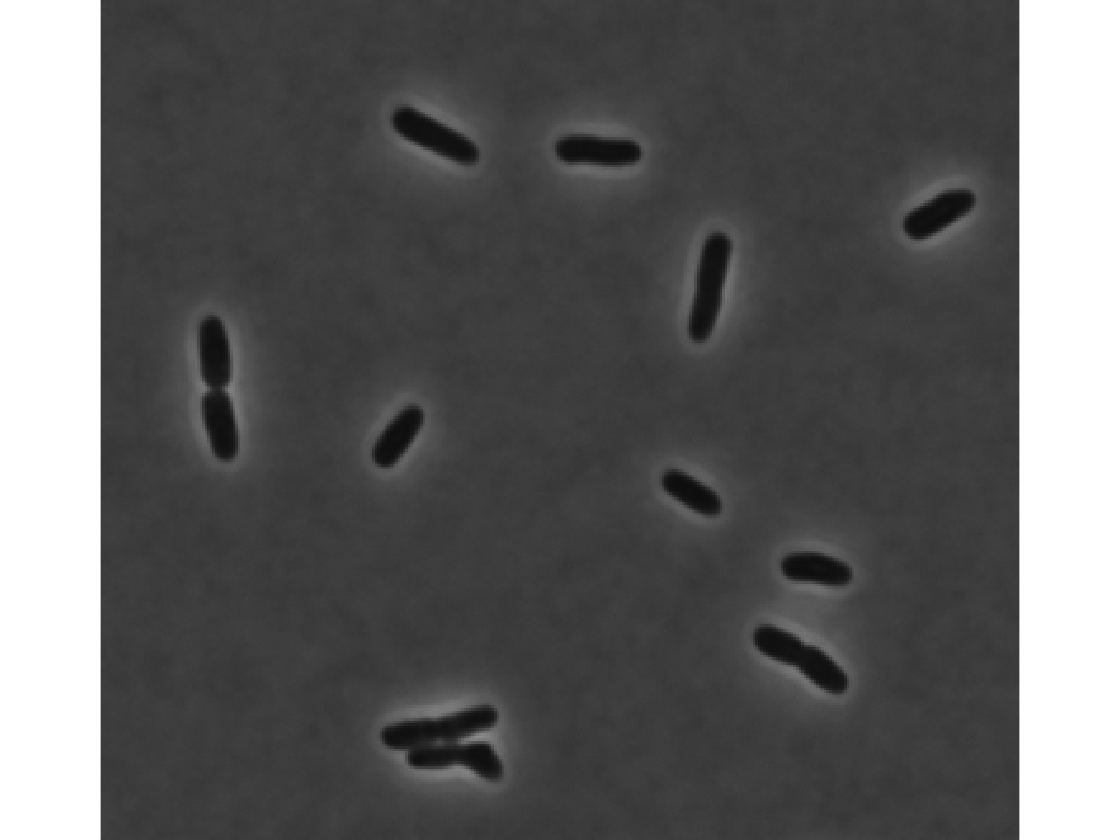
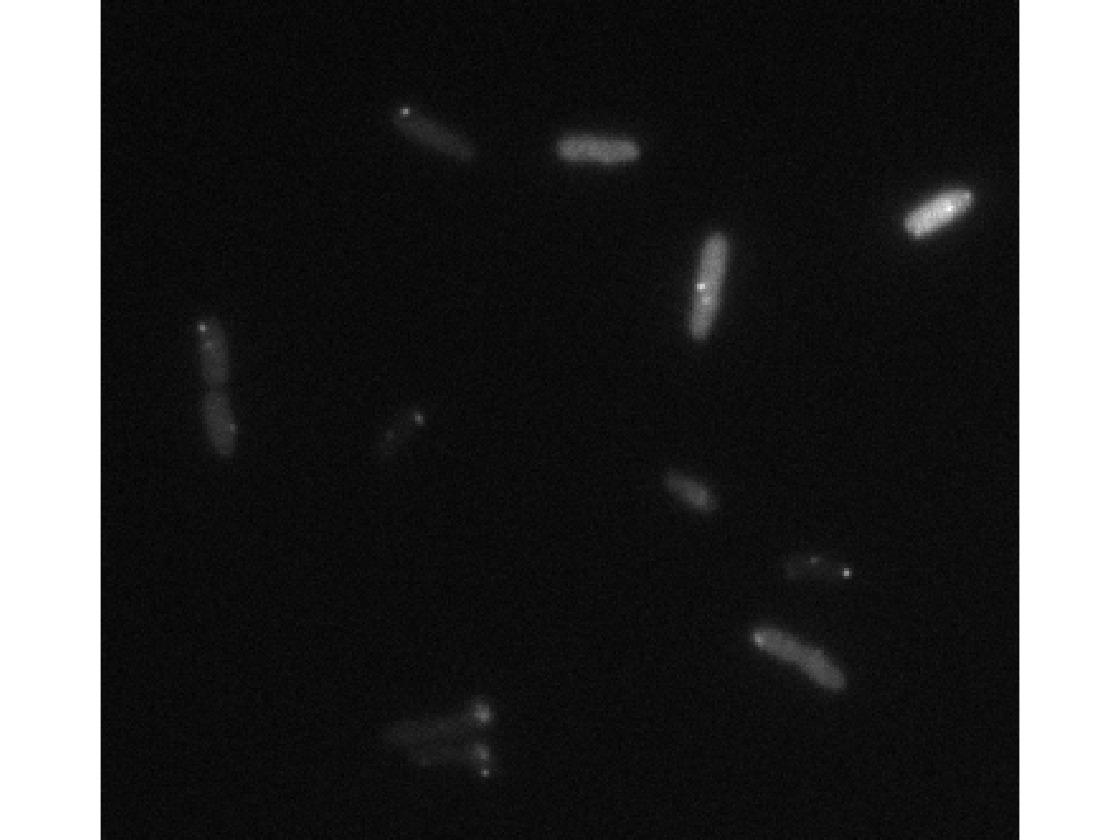
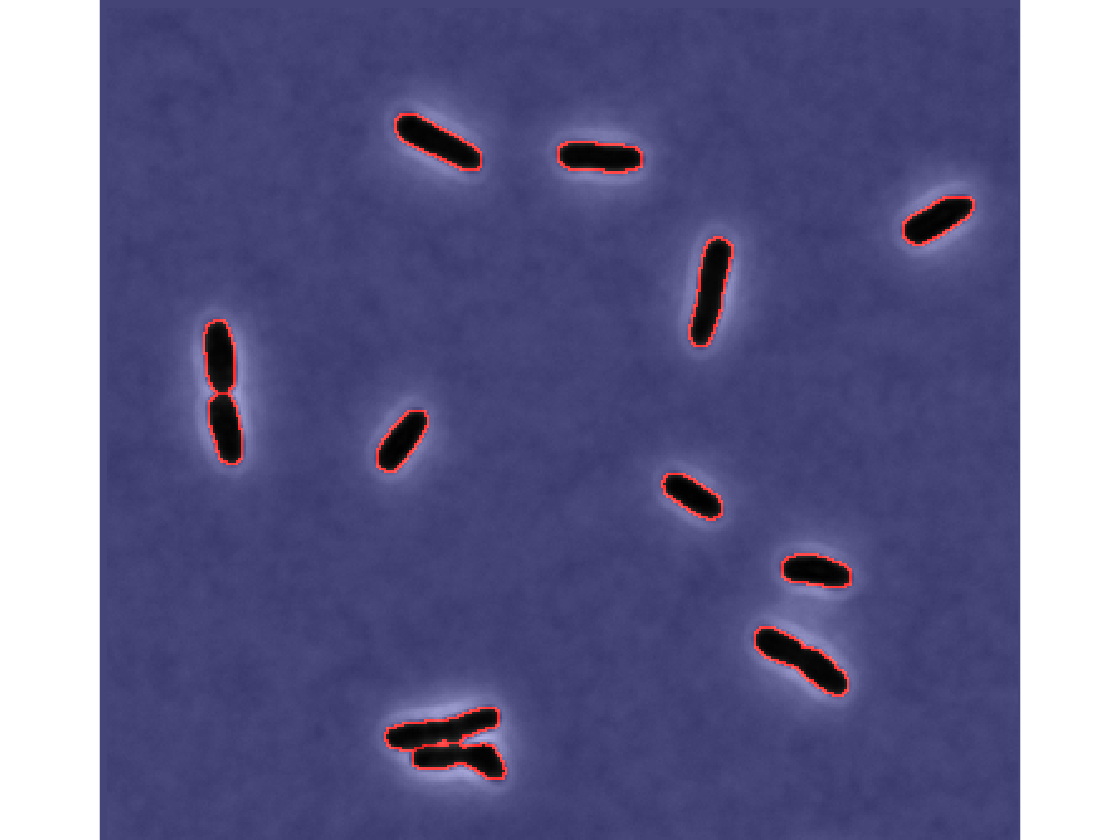
Sample phase and a fluorescence image
imageFolder = [dirname,filesep,'raw_im',filesep];

% finds all phase and fluorescence images
phaseIm = dir([imageFolder,'*c1.tif']);
fluorIm = dir([imageFolder,'*c2.tif']);

% reads the first one
phase = imread([imageFolder,phaseIm(1).name]);
fluor = imread([imageFolder,fluorIm(1).name]);

figure(1);
clf;
imshow(phase);

figure(2);
clf;
imshow(fluor,[])
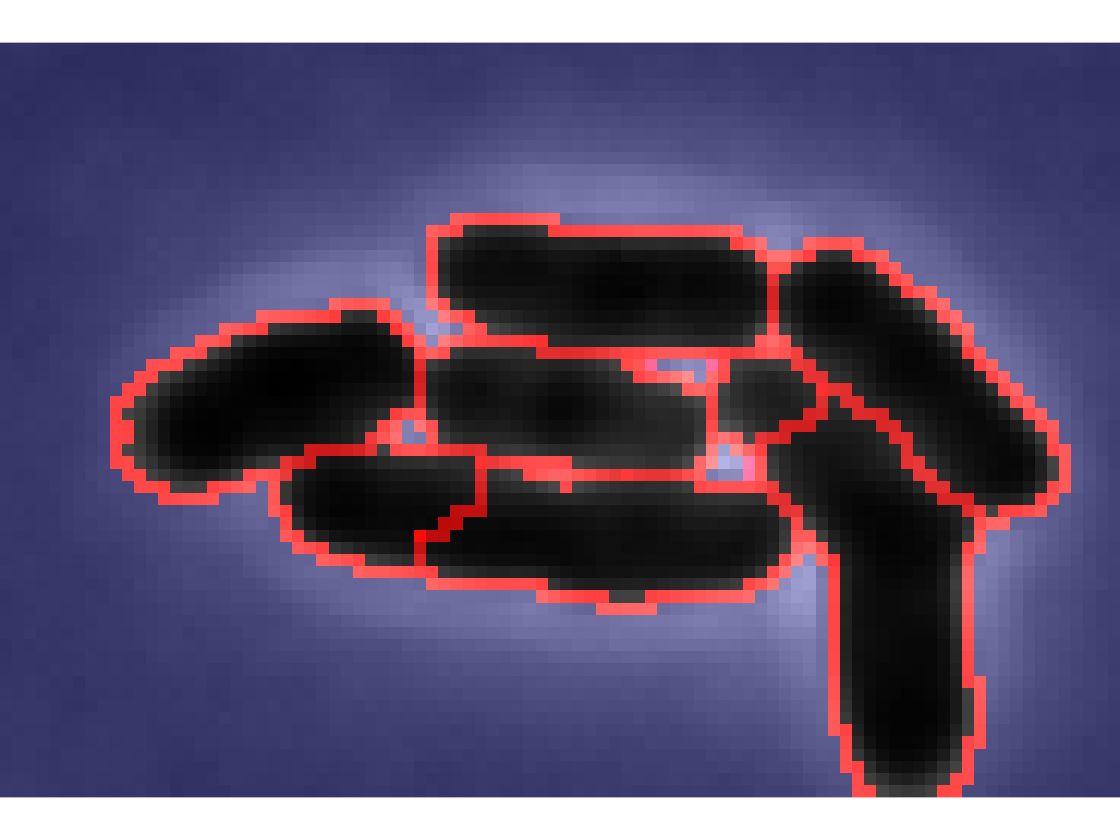
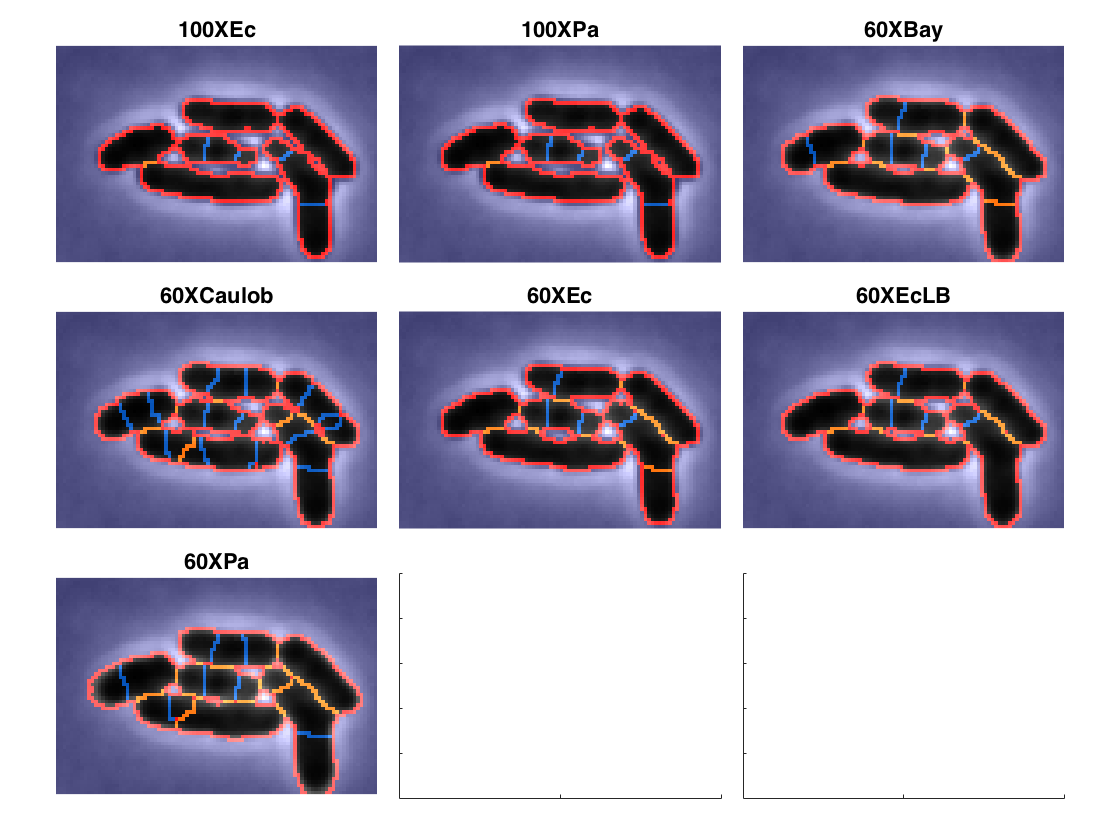
Different segmentation parameters
Try different constants to select the most appropriate one
tryDifferentConstants([dirname,'/raw_im/']);
Pick the first corner of the crop region.
Pick the second corner of the crop region.
Segmenting with 100XEc
loading Constants : 100XEc.mat
Segmenting with 100XPa
loading Constants : 100XPa.mat
Segmenting with 60XBay
loading Constants : 60XBay.mat
Segmenting with 60XCaulob
loading Constants : 60XCaulob.mat
Segmenting with 60XEc
loading Constants : 60XEc.mat
Segmenting with 60XEcLB
loading Constants : 60XEcLB.mat
Segmenting with 60XPa
loading Constants : 60XPa.mat
Set constants
Load the constants and set the desired values
CONST = loadConstants ('60XEclb',0);

% fit up to 5 foci in each cell
CONST.trackLoci.numSpots = [5]; % Max number of foci to fit in each fluorescence channel (default = [0 0])

% find the neighbors
CONST.trackOpti.NEIGHBOR_FLAG = true;

% not verbose state
CONST.parallel.verbose = 0;
loading Constants : 60XEcLB.mat
Segment the data
Setting clean flag to true to resgment data
clean_flag = 1;
close all; % close all figures
BatchSuperSeggerOpti (dirname,1,clean_flag,CONST);
Clean flag is set to true.
BatchSuperSeggerOpti : images already aligned
xy1: BatchSuperSeggerOpti : Segmenting Cells
xy1: trackOpti - Step 1: Running trackOptiStripSmall.
xy1: trackOpti - Step 2: Running trackOptiLinkCell.
xy1: ErRes: Frame: 4 already has an id 12
xy1: ErRes: Frame: 8 already has an id 7
xy1: ErRes: Frame: 9 already has an id 8
xy1: ErRes: Frame: 15 already has an id 8
xy1: ErRes: Frame: 15 already has an id 13
xy1: ErRes: Frame: 23 already has an id 11
xy1: ErRes: Frame: 37 already has an id 3
xy1: ErRes: Frame: 38 already has an id 19
xy1: ErRes: Frame: 41 already has an id 3
xy1: ErRes: Frame: 41 already has an id 17
xy1: ErRes: Frame: 46 already has an id 8
xy1: ErRes: Frame: 46 already has an id 8
xy1: ErRes: Frame: 48 already has an id 24
xy1: ErRes: Frame: 50 already has an id 12
xy1: ErRes: Frame: 53 already has an id 10
xy1: ErRes: Frame: 60 already has an id 12
xy1: ErRes: Frame: 60 already has an id 24
xy1: trackOpti - Step 3: Running trackOptiCellMarker.
xy1: trackOpti - Step 4: Running trackOptiFluor.
xy1: trackOpti - Step 5: Running trackOptiMakeCell.
xy1: trackOpti - Step 6: Running trackOptiFindFoci.
xy1: trackOpti - Step 7: Running trackOptiClist.
xy1: trackOpti - Step 8: Running trackOptiCellFiles.
Load an individual cell file
cell_dir = [dirname,filesep,'xy1',filesep,'cell',filesep];
cellData = dir([cell_dir,'Cell*.mat']);
data = load([cell_dir,cellData(1).name]);
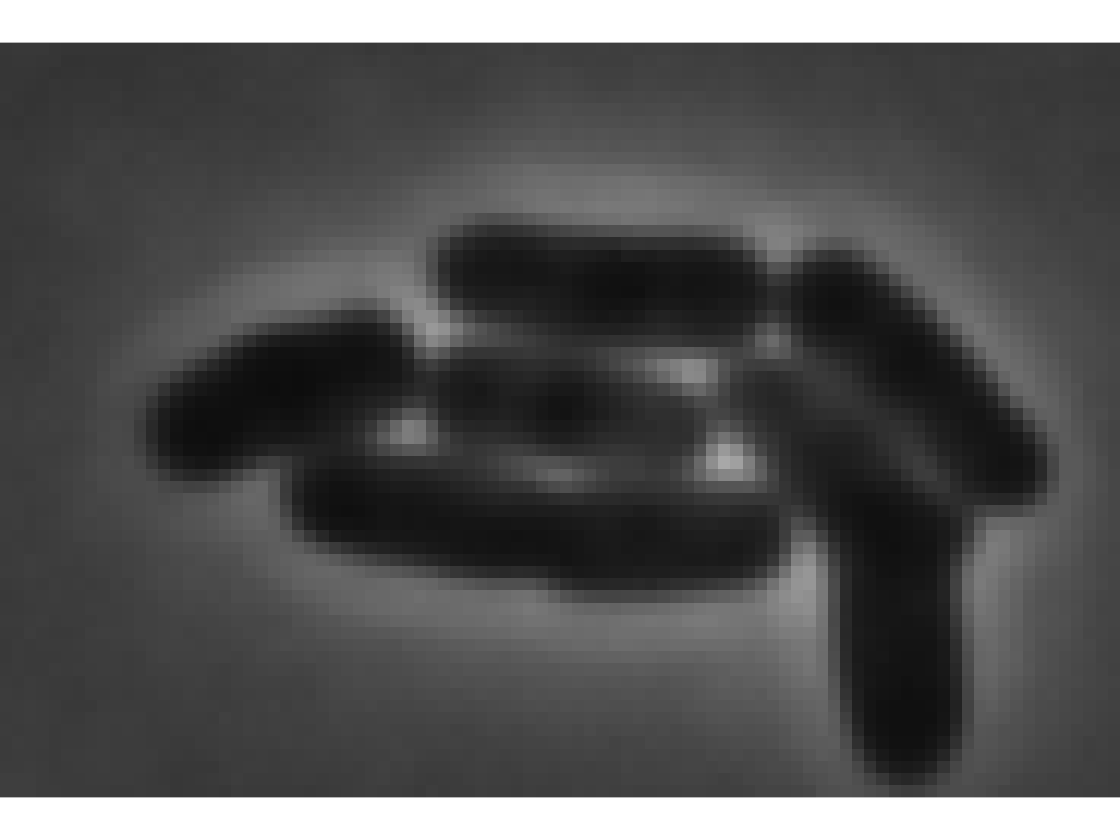
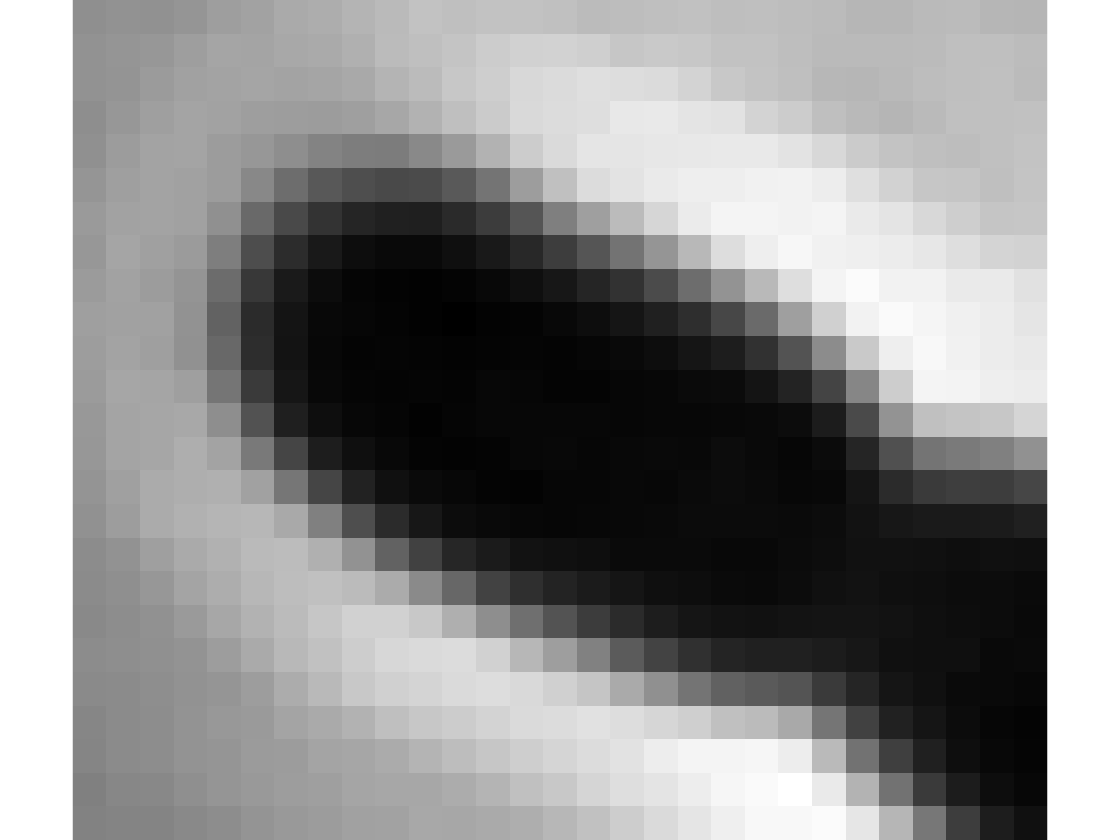
Cell phase image
Show the phase image for frame 1
timeFrame = 1;
figure;
clf;
imshow(data.CellA{timeFrame}.phase,[]);
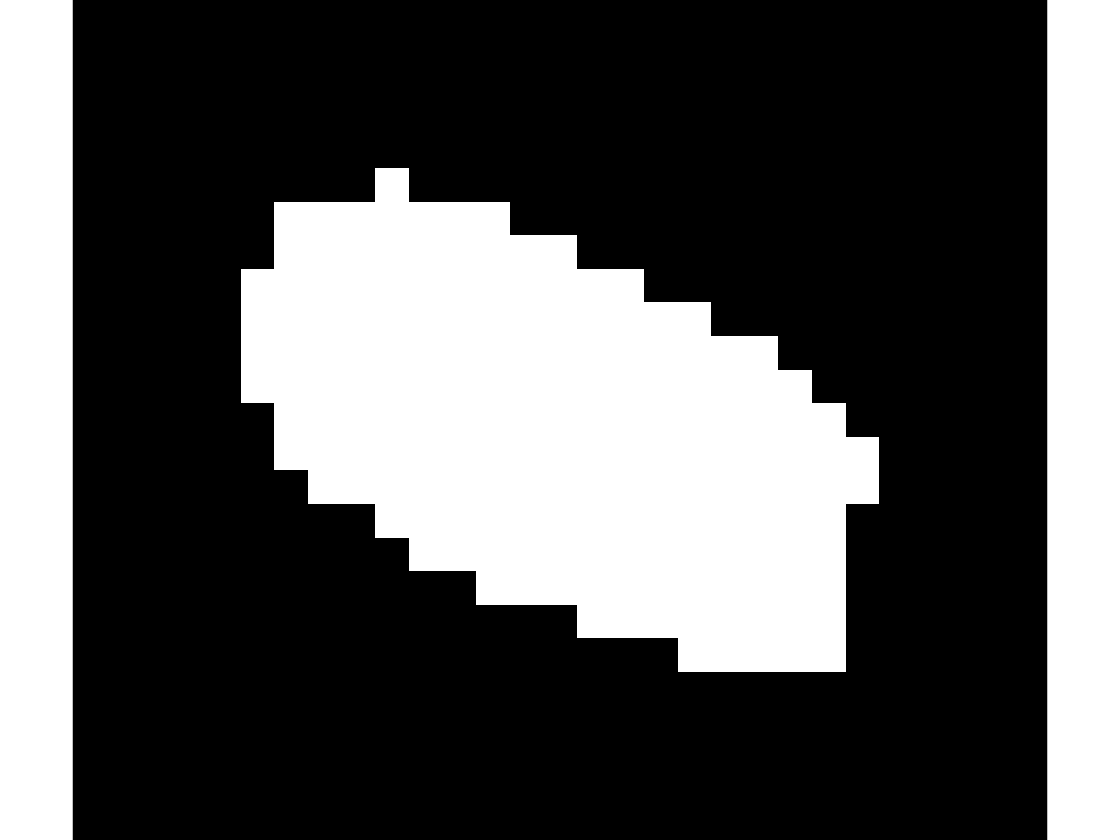
Cell Mask
Show the cell mask for frame 1
mask = data.CellA{timeFrame}.mask;
figure;
clf;
imshow(mask);
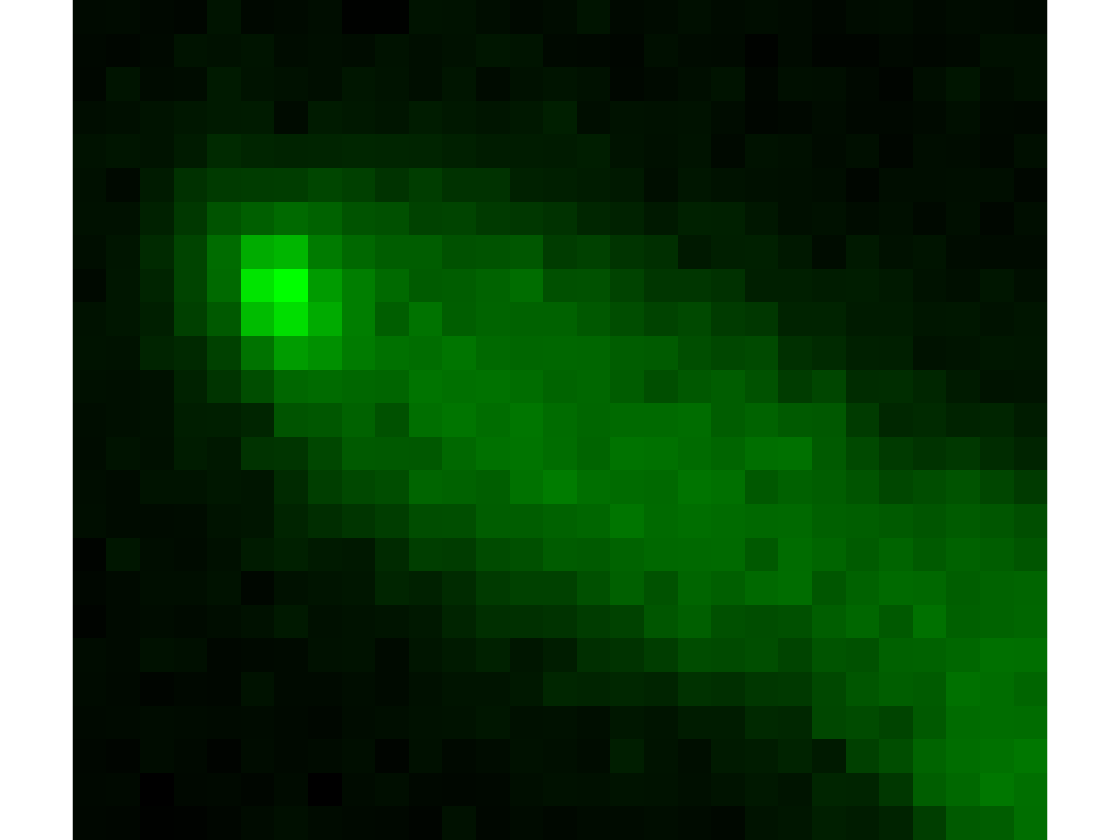
Fluorescence image
Show the fluorescence image for frame 1
figure;
clf;
imshow(cat(3,mask*0,ag(data.CellA{timeFrame}.fluor1),mask*0),[]);
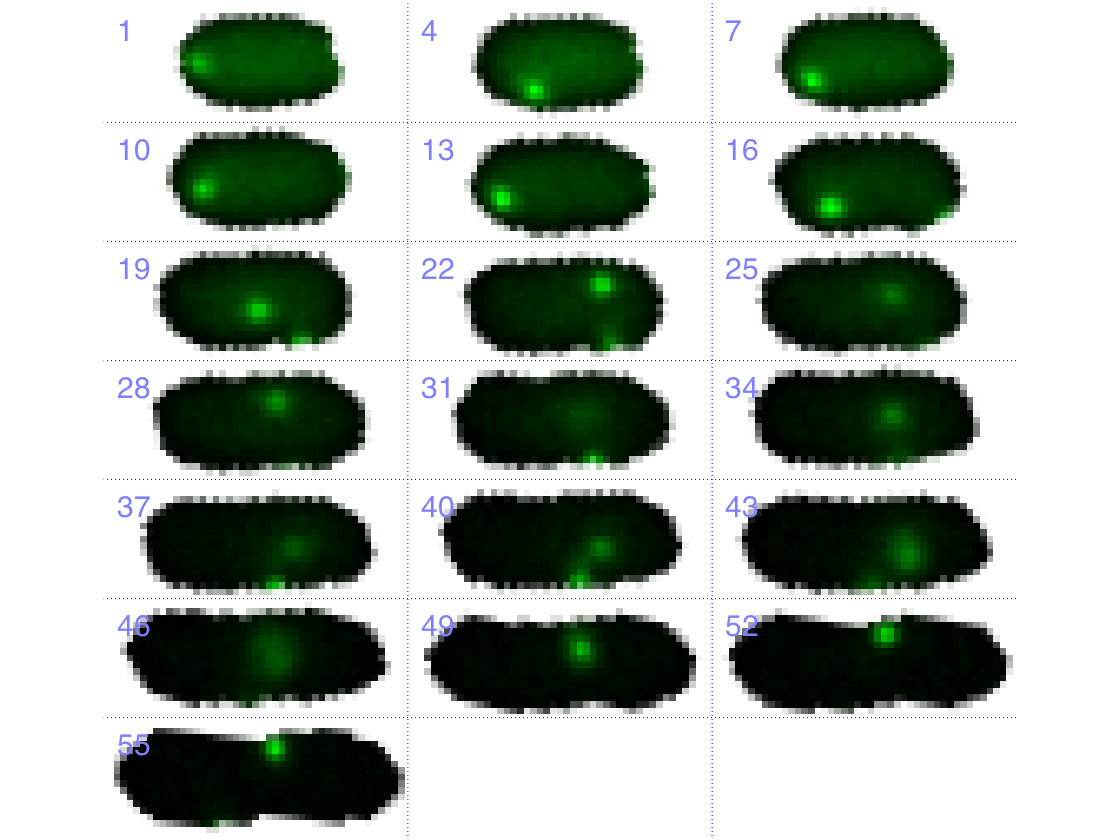
Cell tower
create a cell tower for the loaded cell.
im_tmp = makeFrameMosaic(data, CONST,3,1,3);
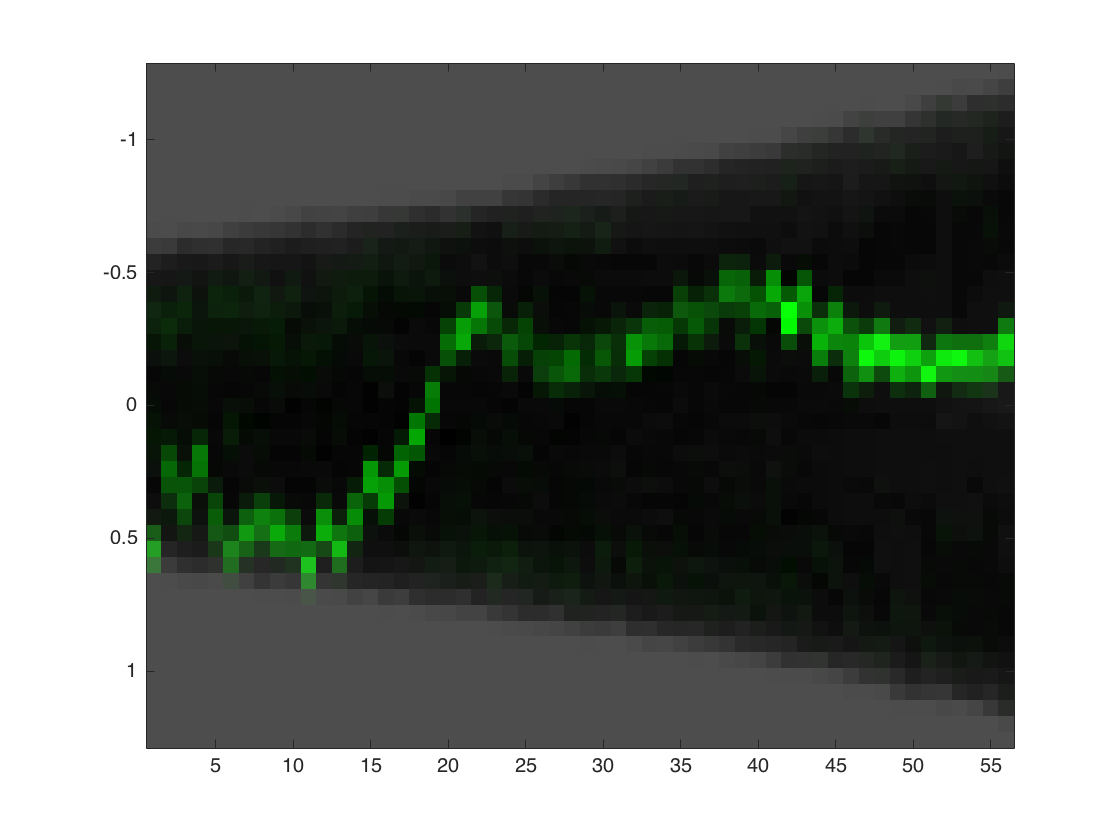
Kymograph
create a kymograph for the loaded cell.
makeKymographC(data,1,CONST,1);
Clist
Load the clist
clist = load([dirname,'/xy1/clist.mat']);
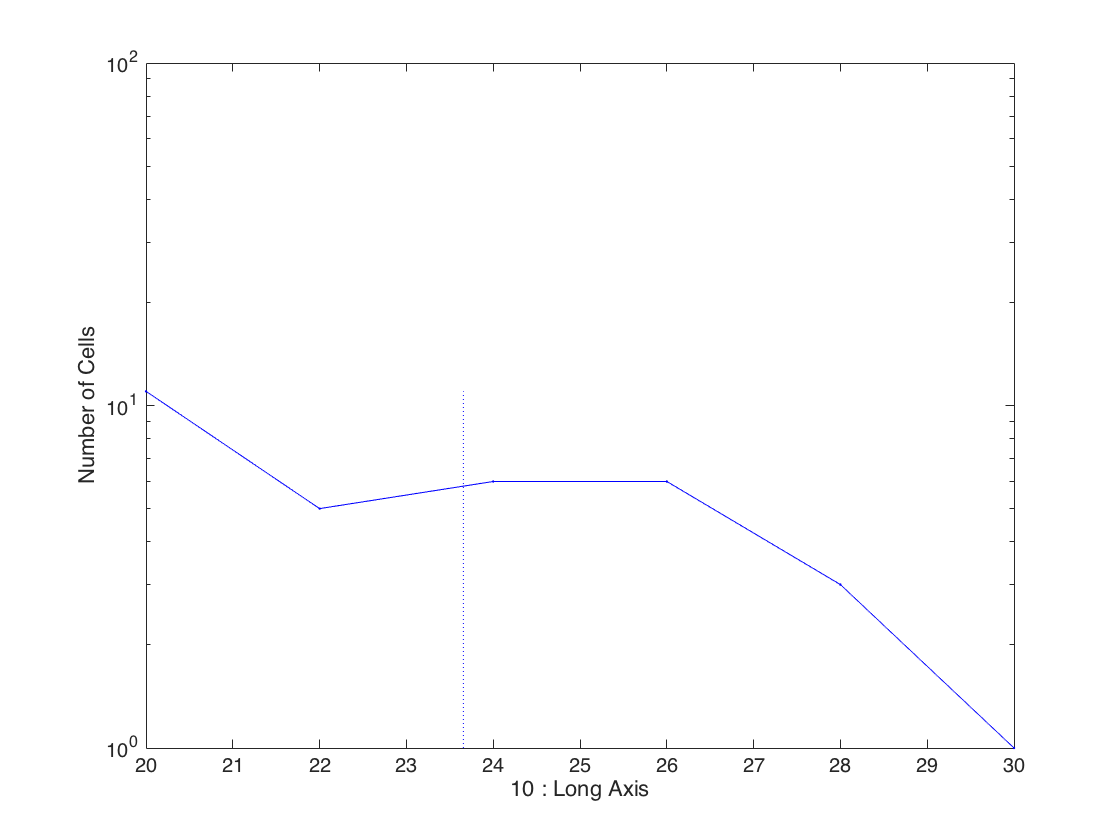
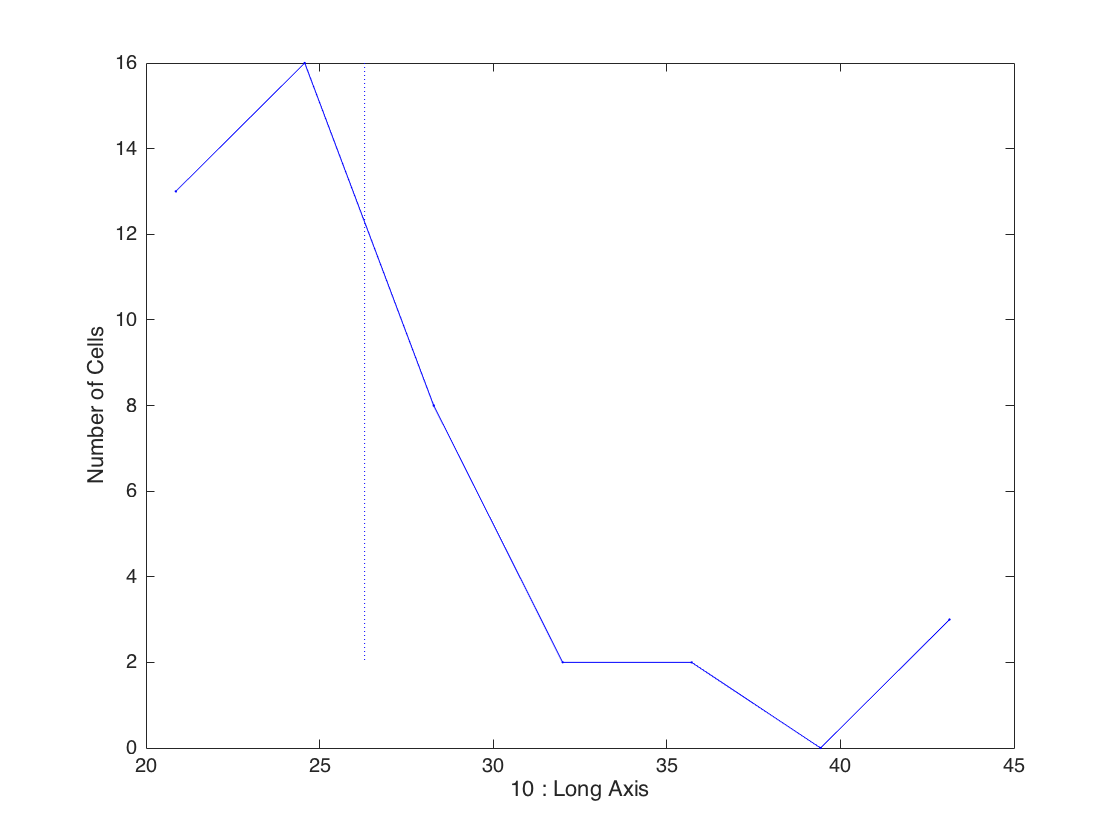
Histogram
Plot the long axis at birth
clf;
gateHist(clist,10);
Gate and re-plot the histogram
Take only cells for which the birth was observed and display the long axis at birth.
% Gate on quantity (4) which is the birth frame
% and take only values from 2 - 100, i.e. discard cells that were born
% in the first frame.
clistGated = gateMake(clist,4,[2 100]);

% plotting for the gated clist the long axis at birth
gateHist(clistGated,10);