| Home | Gene Index | Wiggins Lab | Invert Page |
| Gene name: | ilvC |
| Strain: | JW3747 |
| Induction: | 50 uM IPTG |
| Comment: | 8A2A |
| Reference: | PMID:16769691--ASKA Collection--Kitagawa et al. |
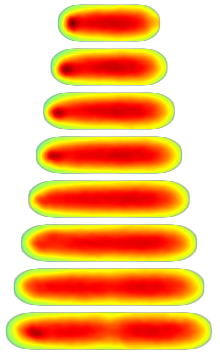
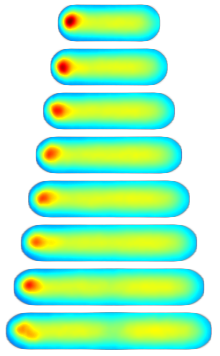
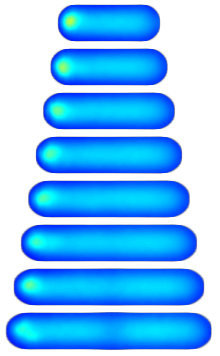
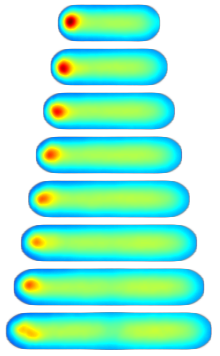
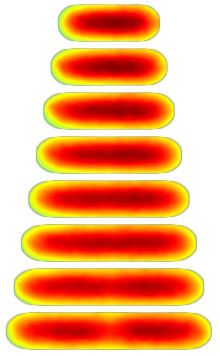
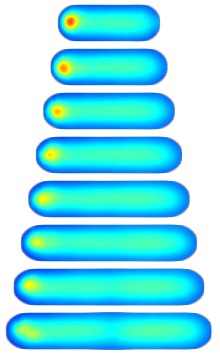
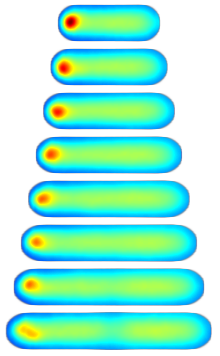
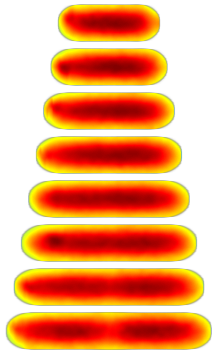
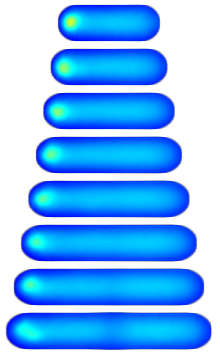
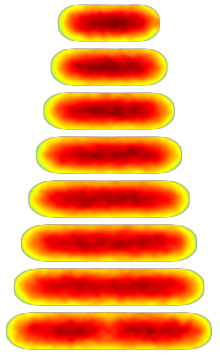
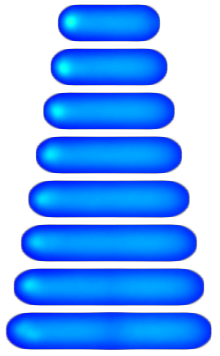
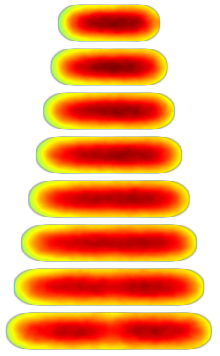
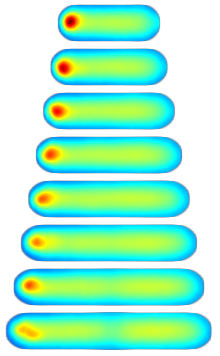
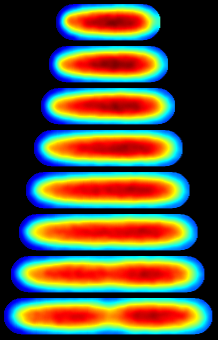
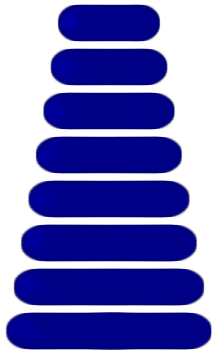
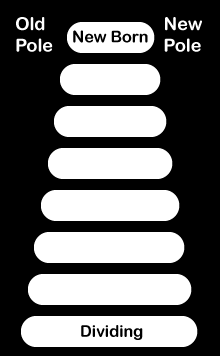
Consensus Protein Localization:The mean image is generated by interpolating the single cell histories onto a reference cell cycle.Time is measured relative to the cell cycle length and position is measured relative to the cell geometry. The std image is the standard deviation in intensity. The error image is the predicted error in the mean intesnity. The mean, std, and error images share a common normalization: intensity relative to the brightest pixel. The cell histories are individually corrected for protein synthesis, degredation and fluorophore bleahcing by adjust the temporal normalization to maintain a fixed areal mean intensity throughout the cell cycle. | ||||
 |
 |
 |
 |
 |
Mean Intensity NCell = 801 |
Std Intensity NCell = 801 |
Error Intensity NCell = 801 |
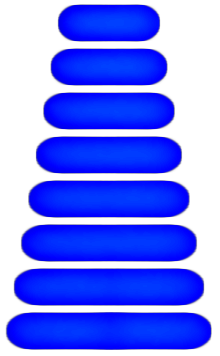
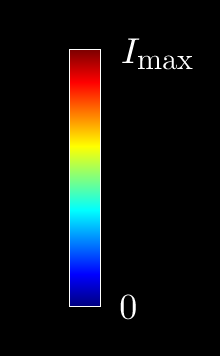
Cell Orientation | Relative Intensity |
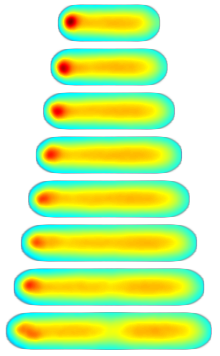
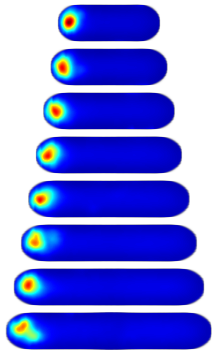
Principal Component Analysis (Cell-to-Cell Variation):Principal Component Analysis of Cell-to-Cell Variation captures the dominant modes of cell to cell variation. | |||||
 |
 |
 |
 |
 |
 |
Comp: 1 Power: 1 |
Comp: 2 Power: 0.74 |
Comp: 3 Power: 0.59 |
Comp: 4 Power: 0.42 |
Comp: 5 Power: 0.3 |
Comp: 6 Power: 0.23 |
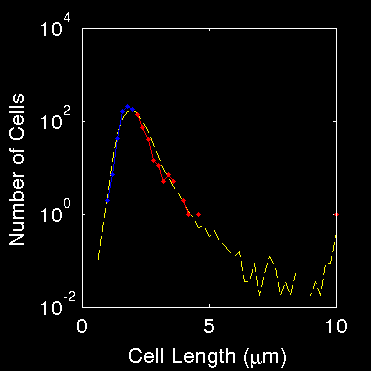
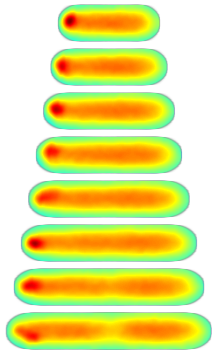
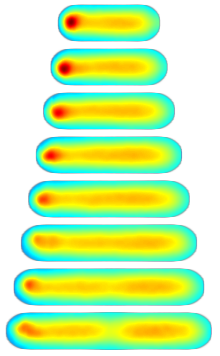
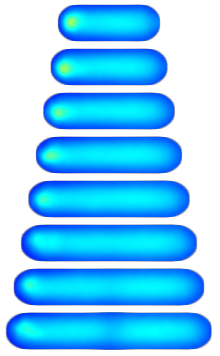
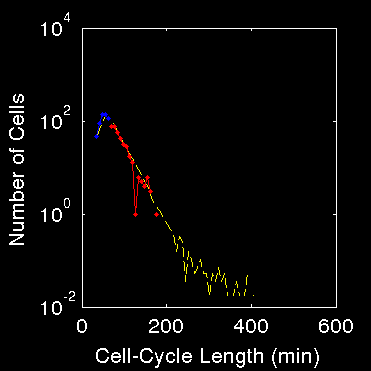
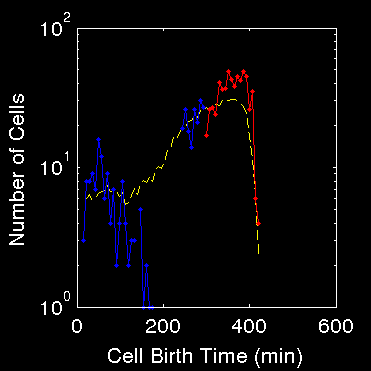
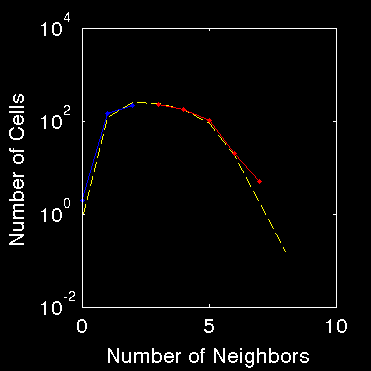
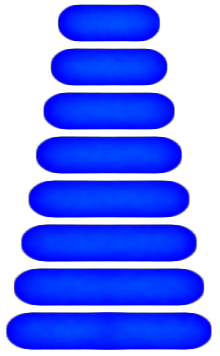
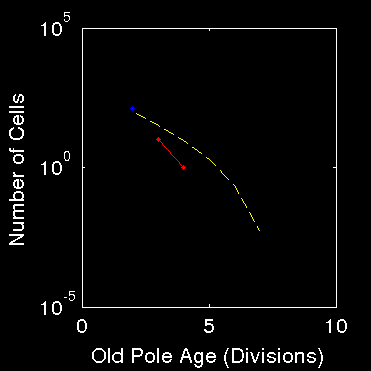
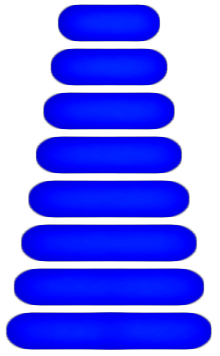
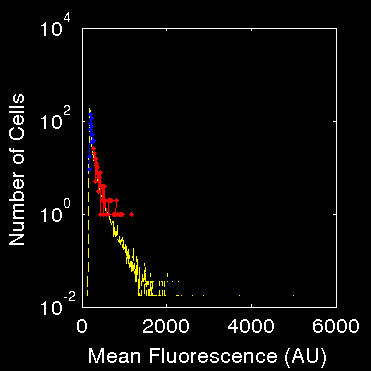
Cell Splits: Subpopulation AnalysisTo investigate the role of cell physiological parameter P (eg cell length) on protein localization, cells are divided into two subpopulations Pcell > Pcut and Pcell > Pcut and consensus images are computed for each. On the left hand side, each image is normalized individually. On right hand side, a common normalization scheme is used for all twelve subpopulation consensus images. On the far right, a histogram is shown for each parameter P for all complete cell cycles collected. The blue (red) curve shows the histogram for the population below (above) Pcut. The yellow curve shows the histogram generated by all fusions strains (typically 48) imaged in the imaging run. | |||||
NCell = 354 |
NCell = 447 |
Cell Length Lcut = 2.1 um |
NCell = 354 |
NCell = 447 |
|
NCell = 339 |
NCell = 462 | Cell-Cycle Length Tcut = 68.0 min |
NCell = 339 |
NCell = 462 |
|
NCell = 524 |
NCell = 277 | Cell Birth Time Tcut = 300.1 min |
NCell = 524 |
NCell = 277 |
|
NCell = 459 |
NCell = 342 | Number of Neighbors Ncut = 2.9 cells |
NCell = 459 |
NCell = 342 |
|
NCell = 687 |
NCell = 114 | Pole Age Tcut = 2.1 divisions |
NCell = 687 |
NCell = 114 |
|
NCell = 232 |
NCell = 569 | Cell Fluor Icut = 266.7 AU |
NCell = 232 |
NCell = 569 |
|